Author: Dr. Jack Gillett
Adapted from a talk given at UCL London
Correlation is a vanity metric – here I’m taking the phrase ‘vanity metric’ from Eric Ries’s excellent book ‘The Lean Startup’. In his words, ‘vanity metrics’ are metrics that “sound good, are easily manipulated, and [not without a touch of irony here…] do not necessarily correlate with the numbers that really matter”.
The point I’m getting at is that because the phrase ‘correlation’ is thrown around so much, people come to think of actual, mathematical correlations as being the main thing that matters in data quality comparison. In this post I aim to have a quick look at what correlation actually is, and is not, good for.
Sample correlation r is a very good characterisation parameter for large sets of jointly-normally distributed sets of data. The joint dependence of the two variates is completely characterised by the (‘true’) correlation parameter ρ, and the sample parameter r is a good estimate of ρ for large datasets.
Unfortunately, that’s about all that r is good for.
The sample correlation parameter r is extremely sensitive to noise. Here, the addition of light noise has reduced the sample correlation from 75% to 65% for the same underlying normal distribution. And ALL real-world data will have [at least!] light noise.
There are a few techniques (‘robust’ parameters) that seek to solve these problems, but they tend to be quite messy hacks, assume normality and don’t always [or even often] work.
Even for jointly normal data, correlation is only useful for large datasets. The variance of the sample correlation parameter scales as 1/N, so to have it reliable to a percent or so requires 105-106 data points.
Plotted here is the probability density function for the sample correlation parameter for a set of 100 datapoints coming from an underlying joint normal distribution with ρ=50%. The measured parameter is fairly likely to fall anywhere between 30% and 70%, and any statements comparing ‘quality’ of two different measured datasets based on comparisons of such parameters is almost meaningless.
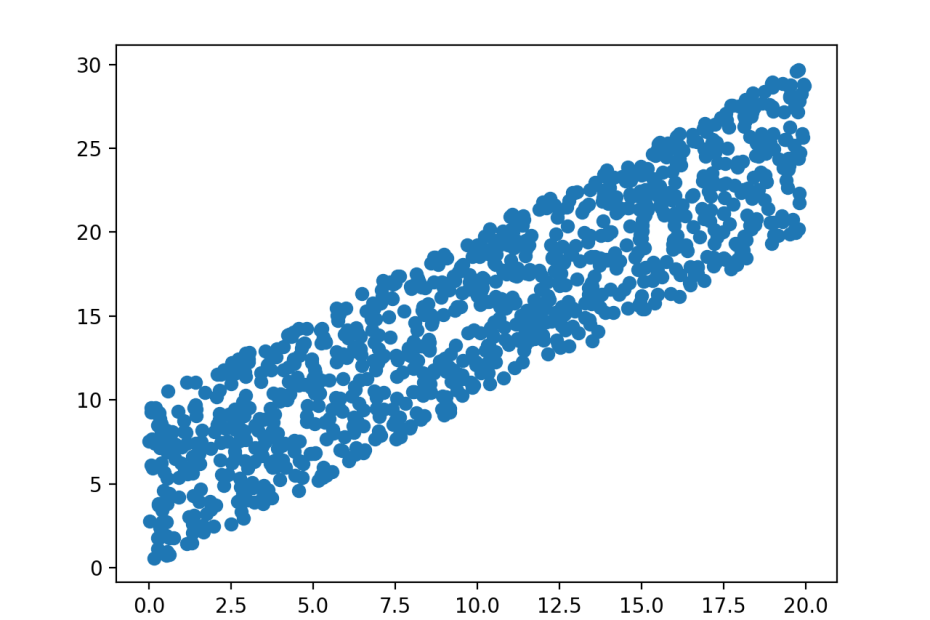
The situation is still worse for data that is not normally distributed. Here are two pairs of variables, both pairs have the same uniform marginal distributions. In both cases, the sample correlation parameter is also the same – but of course these obscures vast differences in the joint behavior of the pairs of variables that become visible from a 2D plot.
If sample correlation isn’t much good with noisy normally distributed data or noiseless-but-small datasets; and still less useful for non-normally distributed data; it should come as no surprise that it is almost never the correct parameter to use with real world data.
Here, a quick example from voting likelihood. Consider the black line, which shows dome-like behavior with voter age. A naïve estimate of r would probably give a correlation of around 0% – but of course this is obscuring a beautiful underlying relationship between the variables.
My point here is two-fold. Firstly, extreme caution is urged when sample correlation is used as a metric for data quality.
More deeply, the degree to which the word ‘correlation’ itself is used is a problem in the industry. Although some people are aware of what they mean by it, more and more ‘correlation’ is used as a clumsy alternative to ‘relationship’, so that other people who are unaware of the caveats come to believe that actual, mathematical correlation is the first thing to consider. I hope I’ve shown here that in most cases, not only is it not the main parameter to consider, but in many cases it’s actively harmful.